Skincare Routine Manager
An interactive skincare routine website
Skincare has exploded in popularity in recent years. People want to treat their skin well, which is great! However, the market is extremely saturated; an unnavigable volume of brands and products cover your pharmacy shelves, your favorite influencer just announced their very own skincare product line, and unrealistic beauty standards tie this all together by making regular people feel like they need to splurge on the trendiest snake oil serum to get the immediate results they’re hoping for.
The skincare industry is worth an estimated $180.3 billion globally–there is no changing the market’s over-saturation. However, I have identified and provided a solution for the average consumer overwhelmed by choice.
The problem:
A single skincare product typically specializes in one component of a routine, such as moisturizing or cleansing. However, customers’ skincare routines are rarely just one, standalone product. Many customers have lengthy, multi-step skincare routines with many different products to juggle and keep straight.
Sometimes products might negatively react when used alongside another, actually worsening your skin. Or, there might be a missed opportunity for a synergy between products in a routine, saving the customer money on unnecessary extra steps.
The solution:
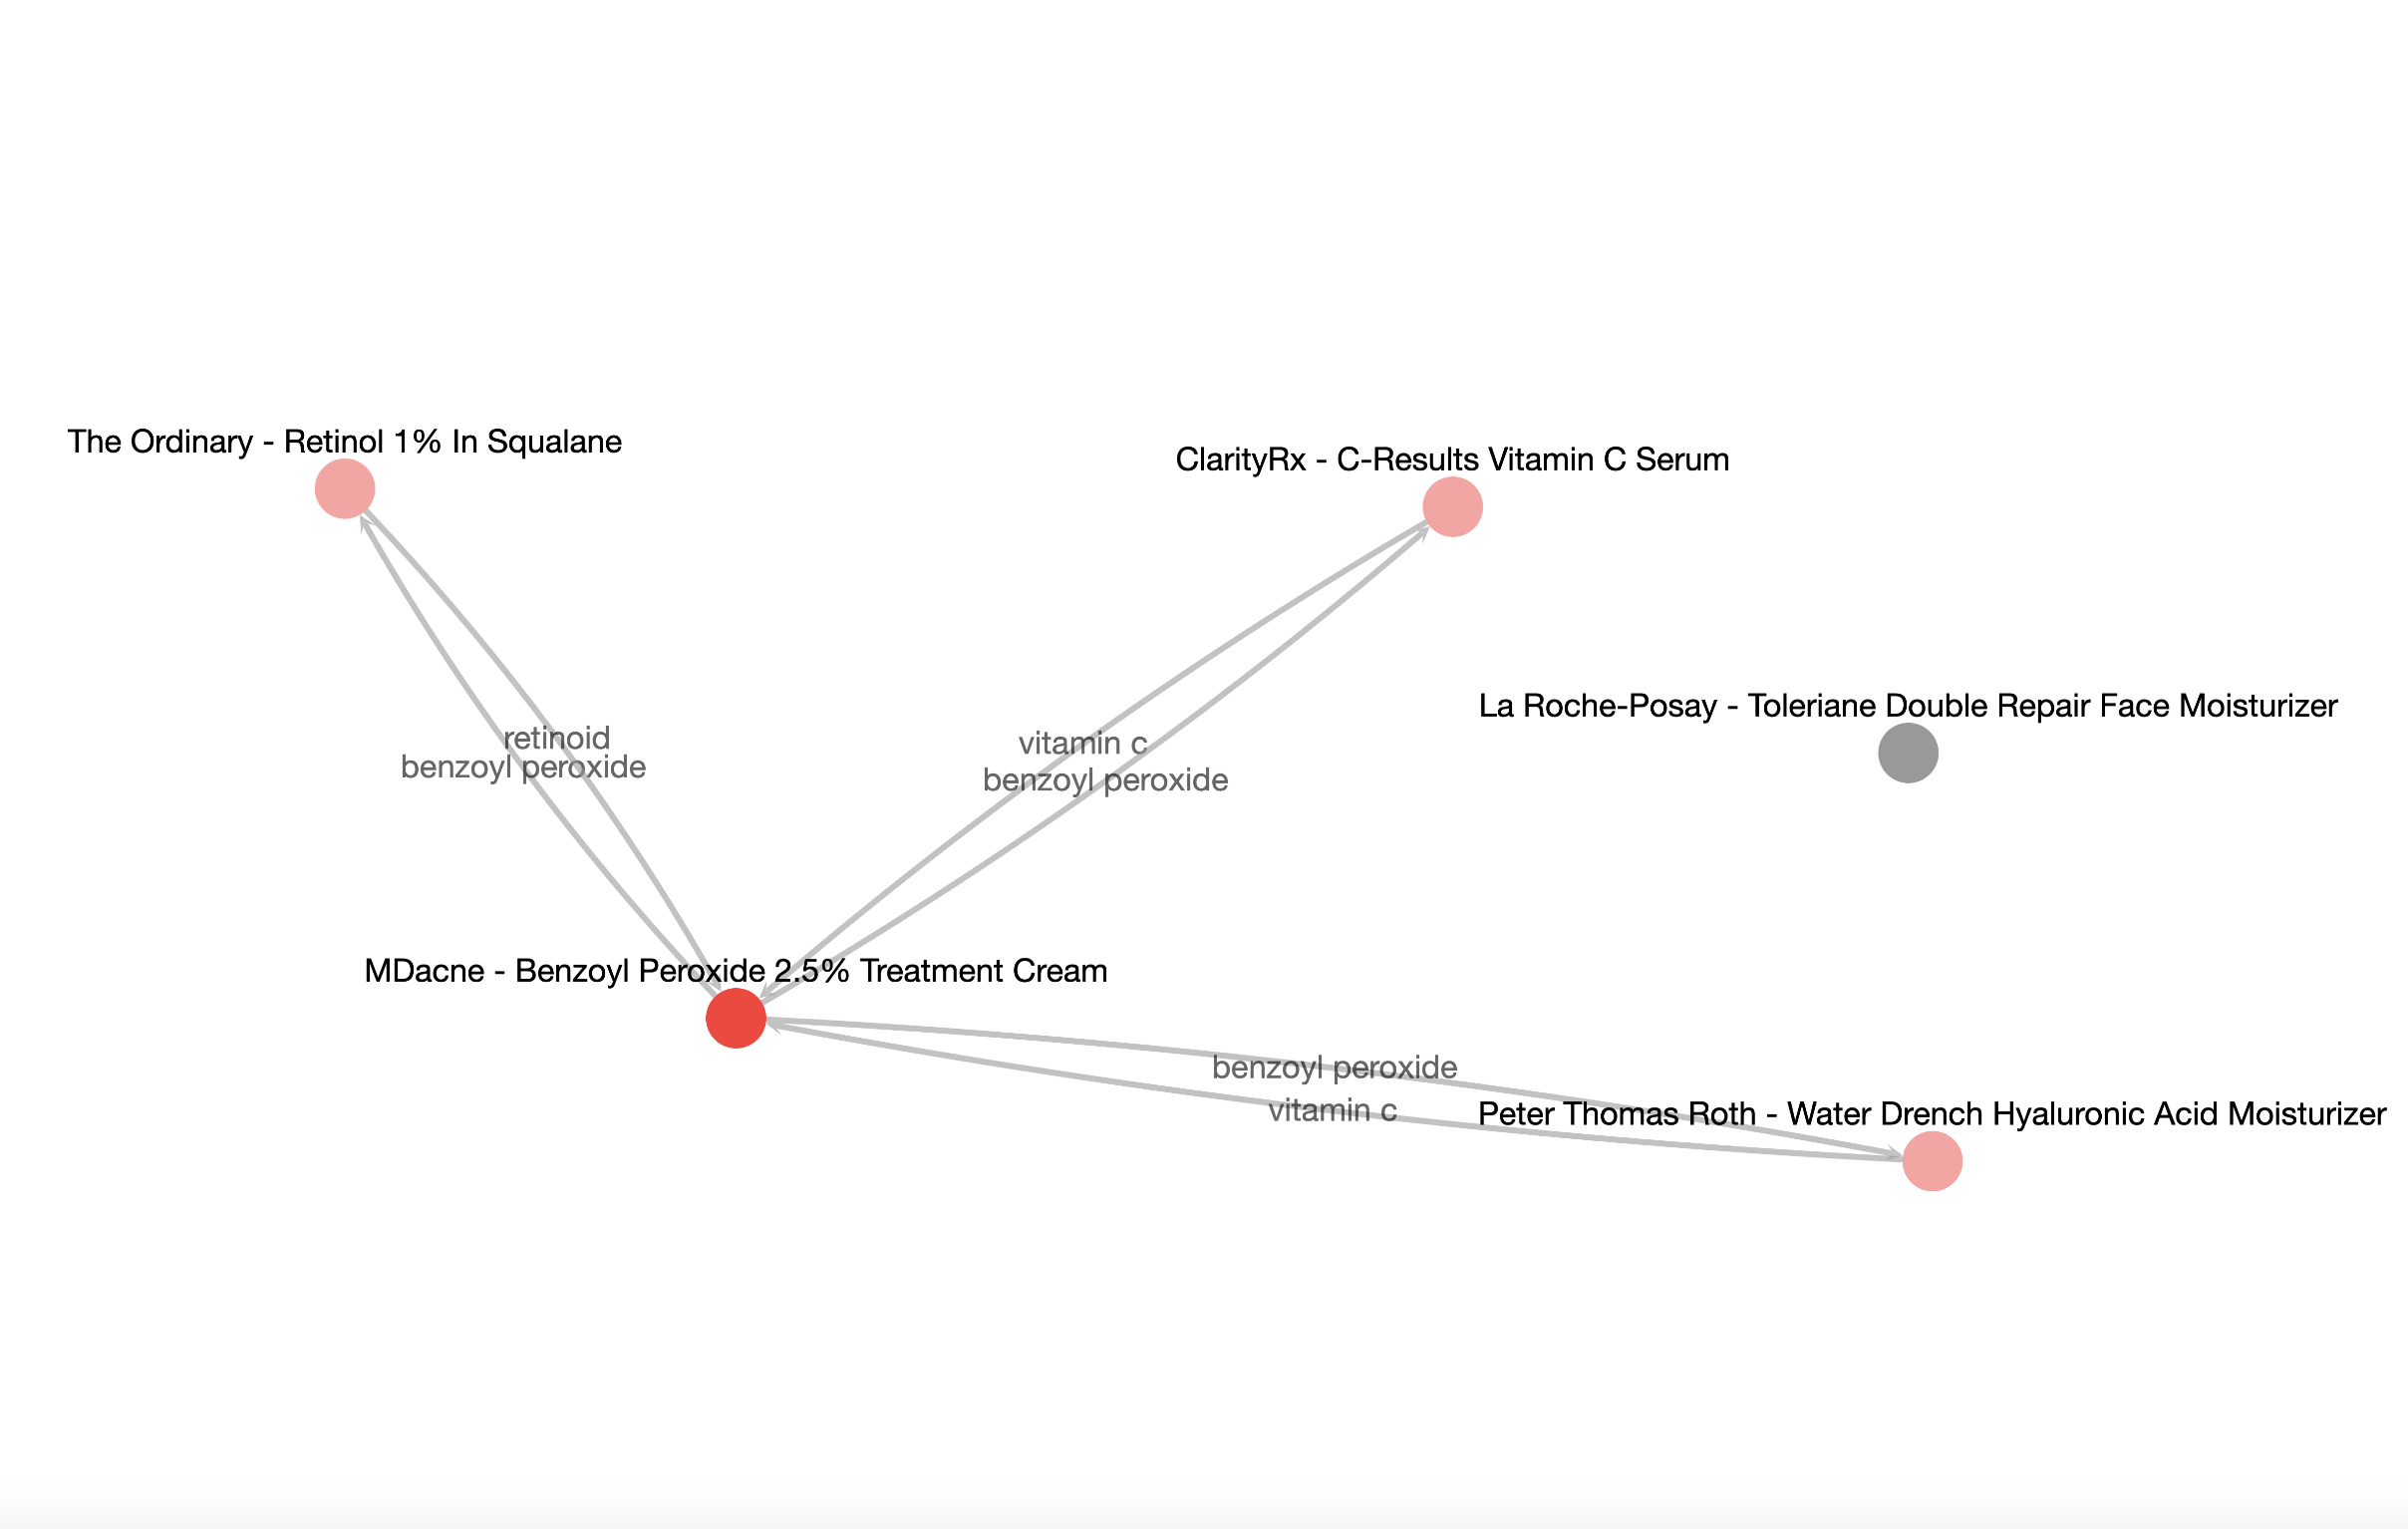
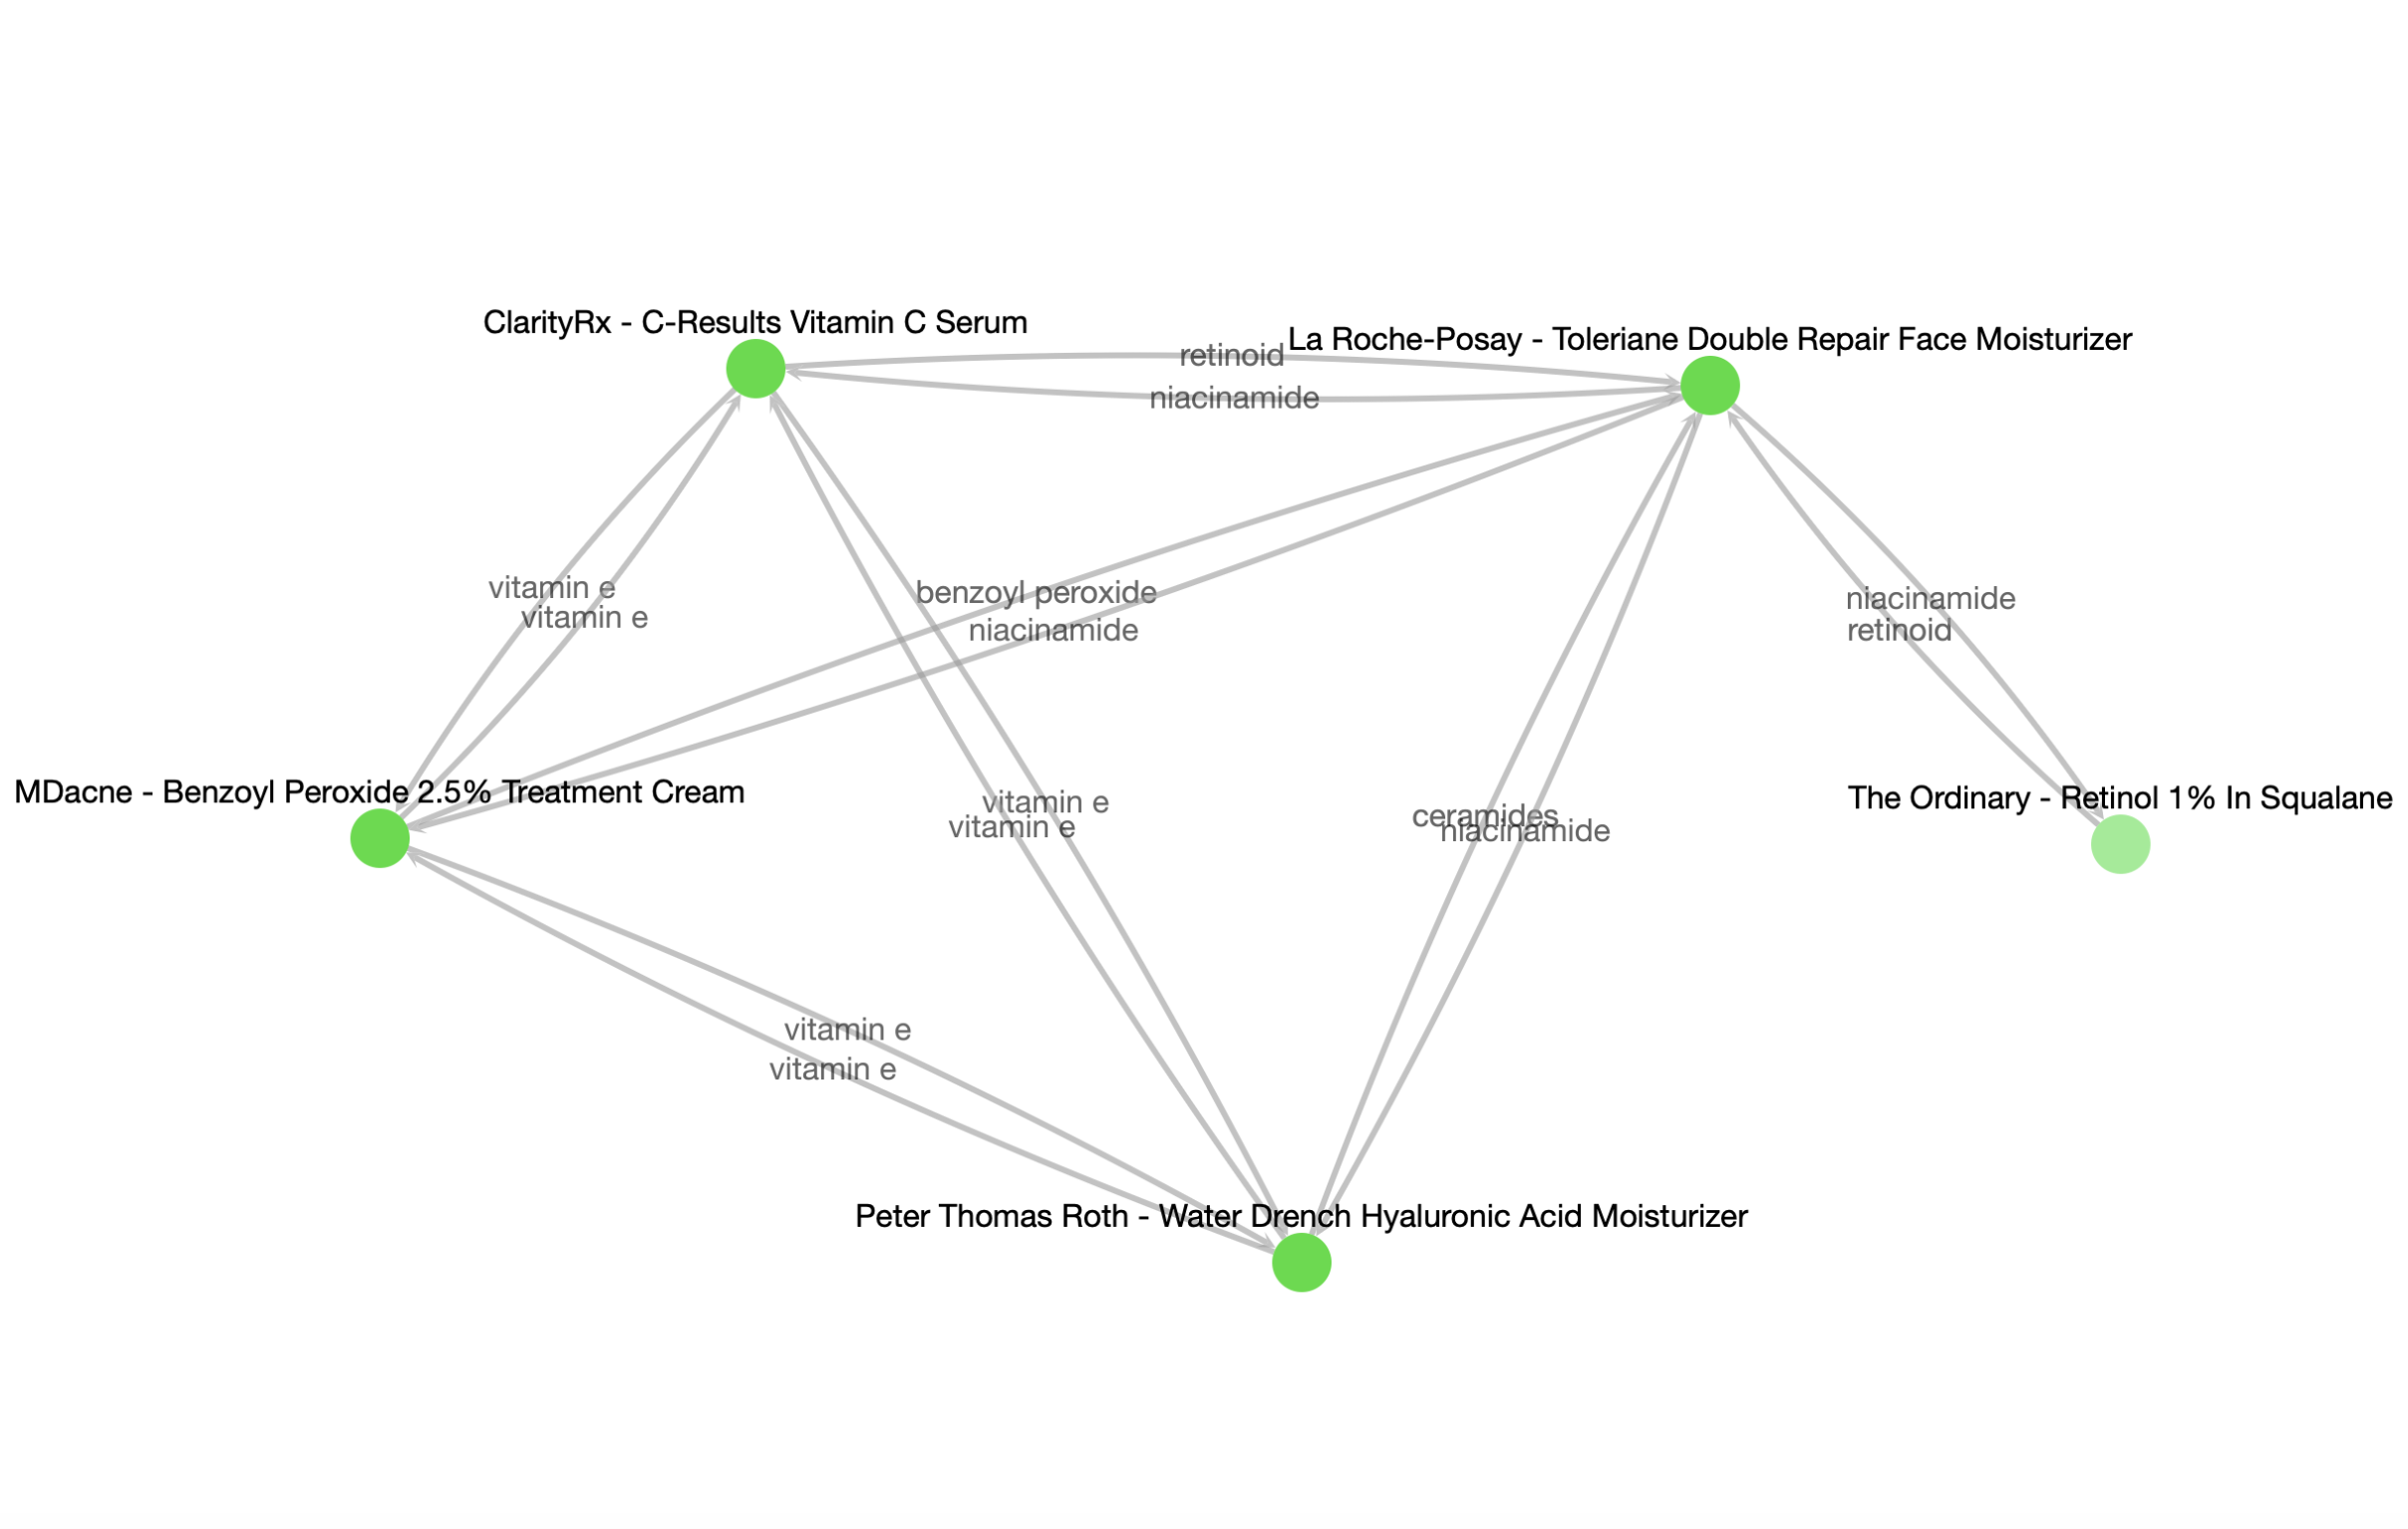
My Skincare Routine Manager project provides users with the data-driven insights behind their routine, highlighting conflicts between known conflicting ingredients, like benzoyl peroxide and retinol, and illustrating synergies between proven ingredient pairings, such as AHAs and BHAs.


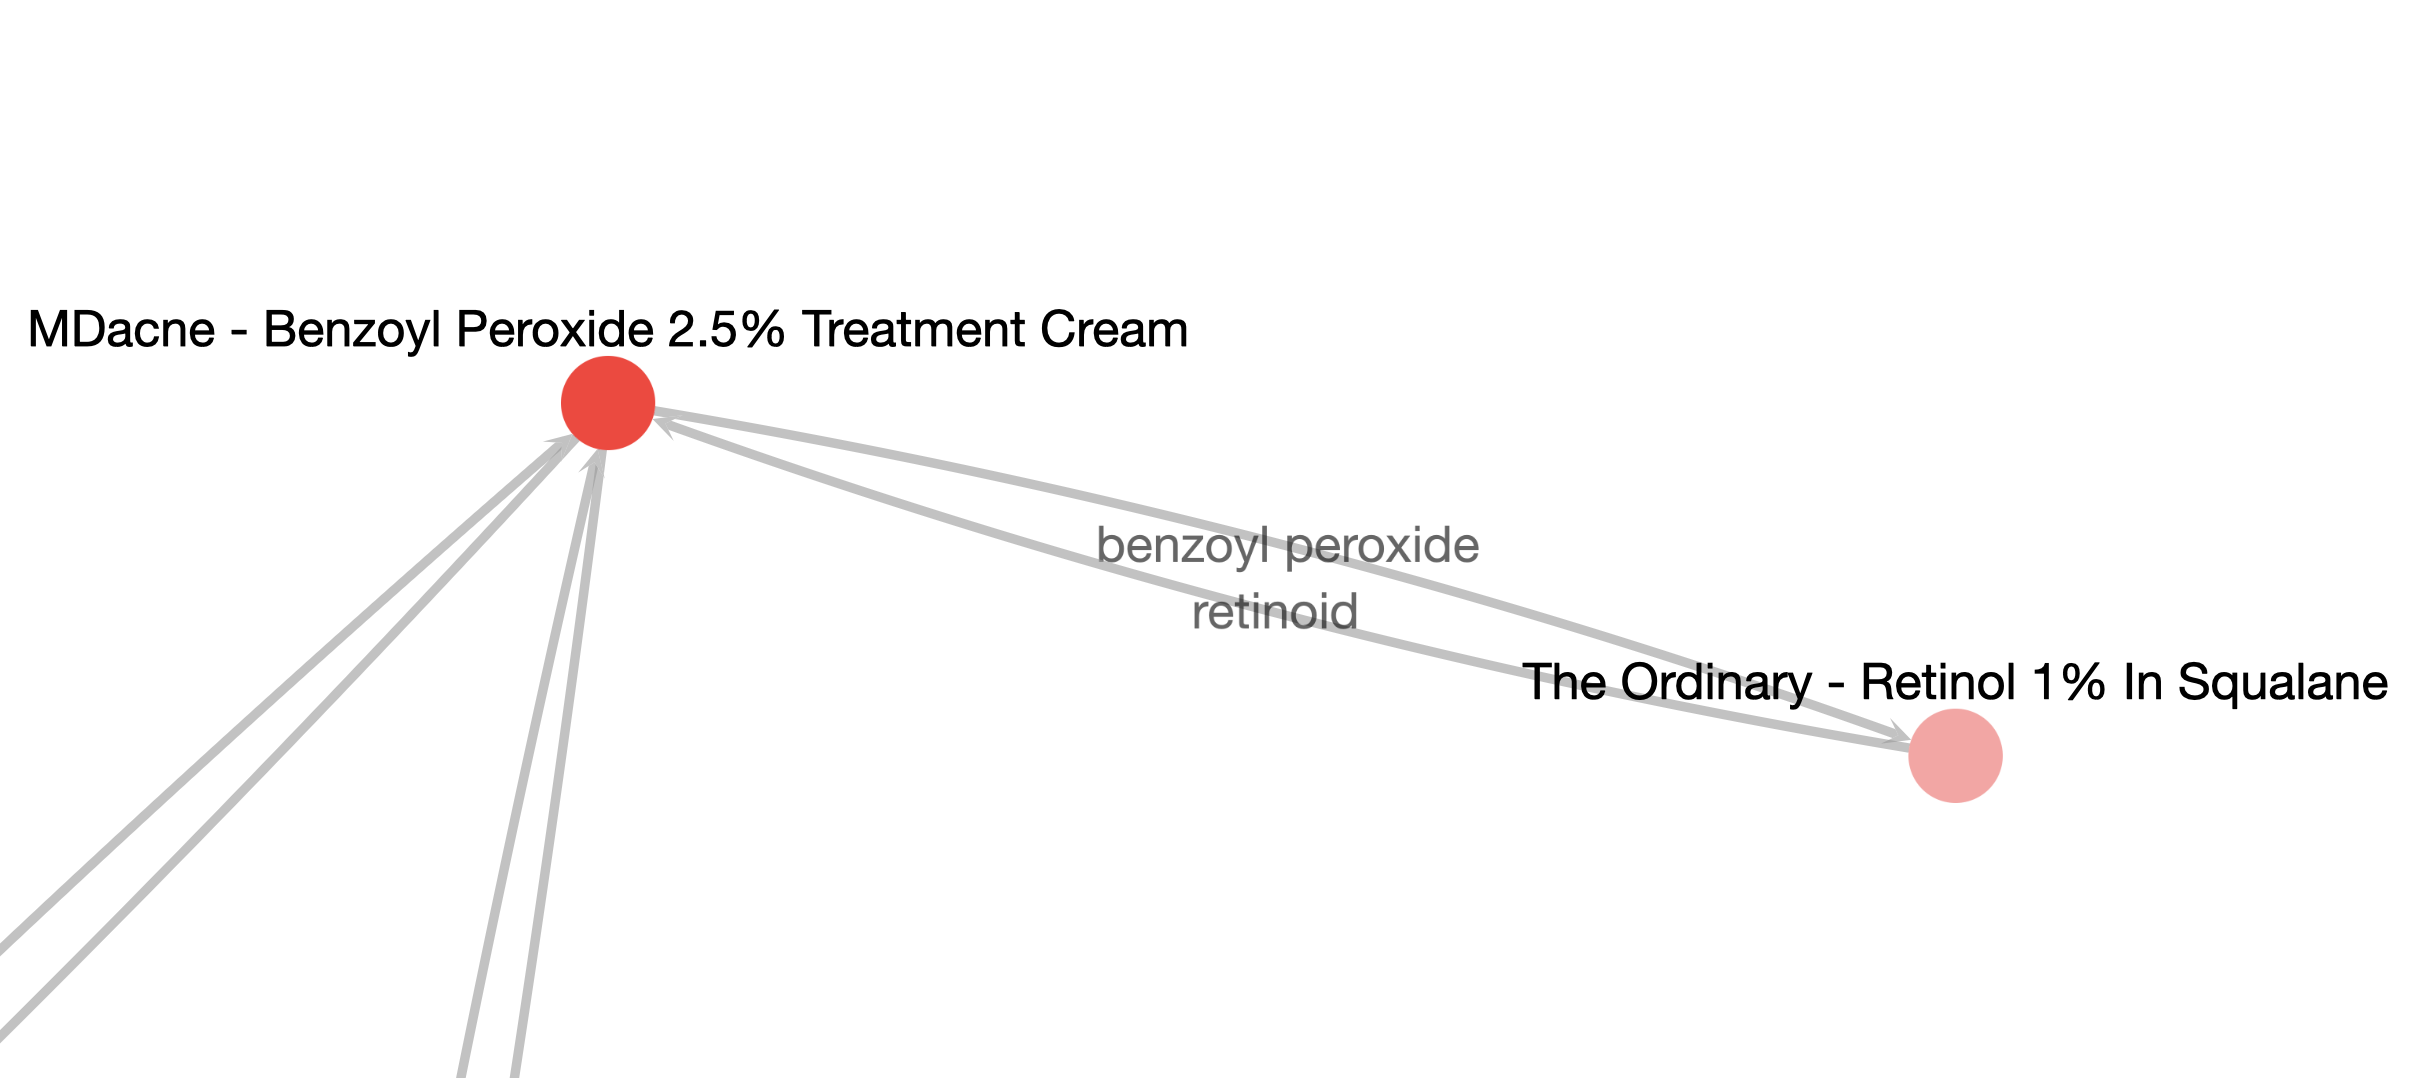
This visualization highlights links between active ingredients within products that either contradict (or pair well, if the synergy option is selected) with other ingredients in the routine. Each node is a product within the user’s routine, and the color of that node gets more intense the more links to other nodes it has. The edges between the nodes are directional, pointing outwards from the product that specific ingredient came from. That’s why there are two links connecting products; one for each ingredient of the conflict (or synergy) pairing.

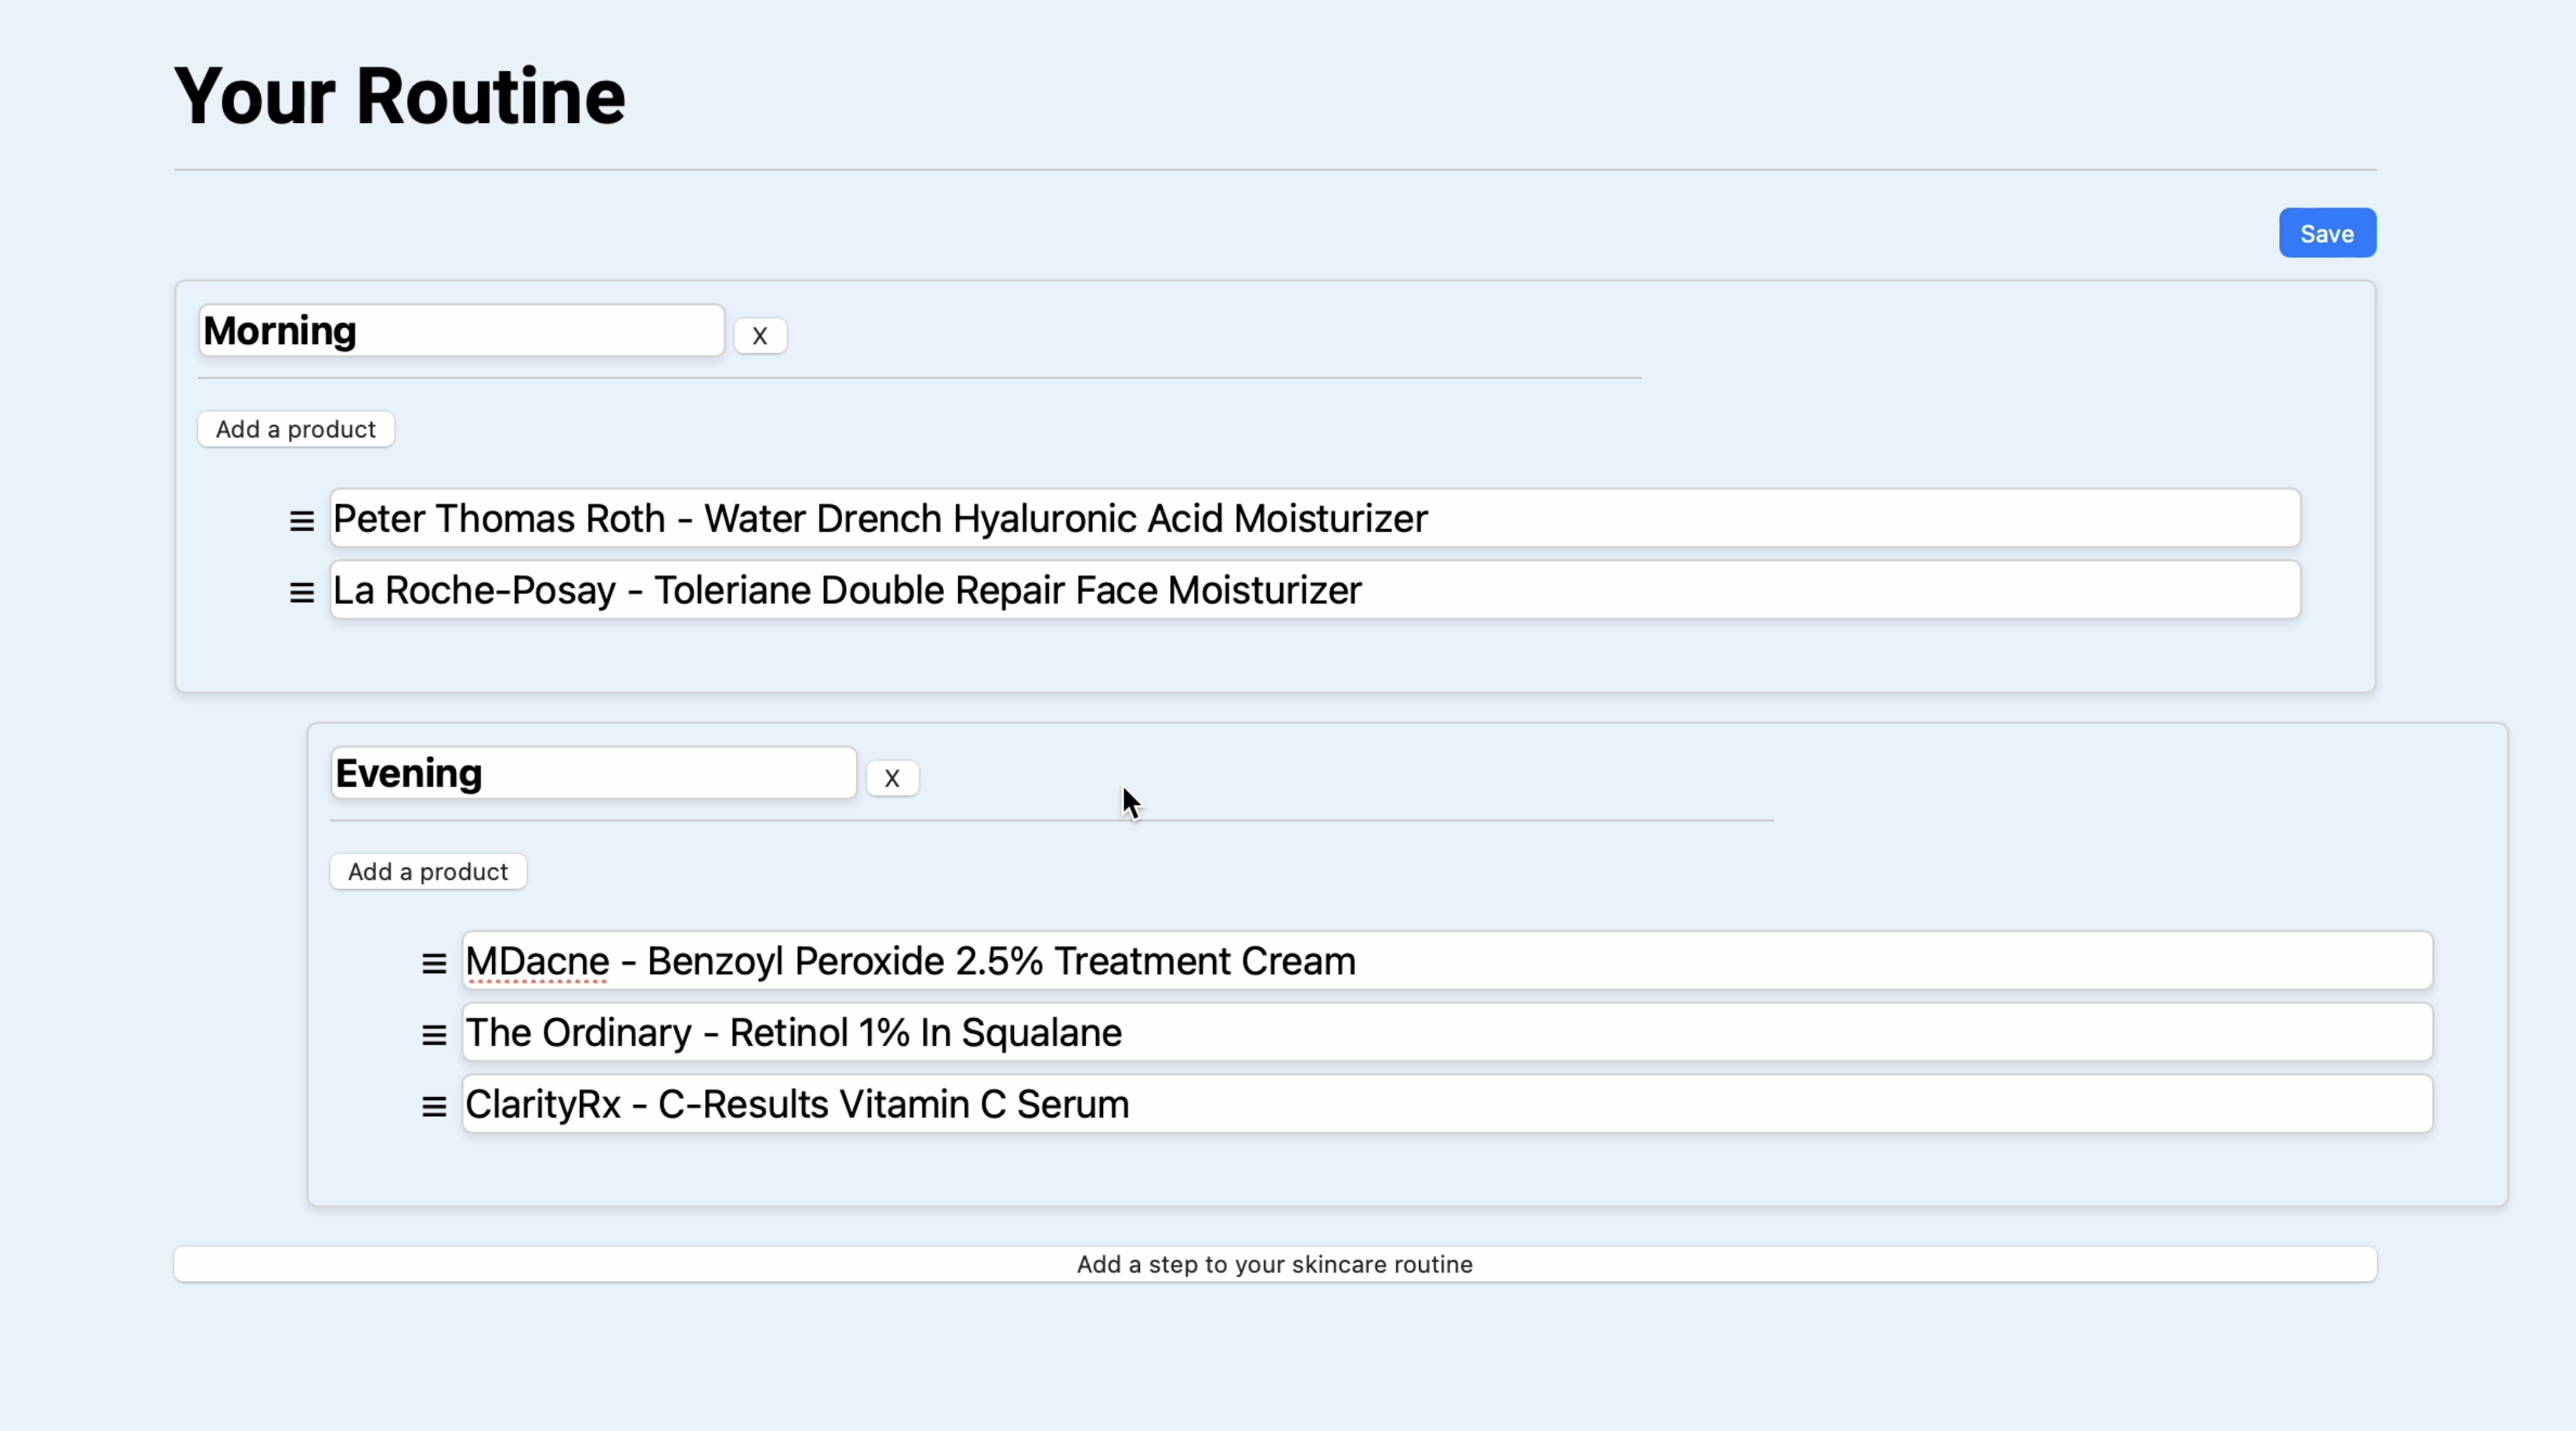
This project was (and continues to be) an incredibly valuable learning experience for me. It’s built on Flask, iterating on the Flask techniques I’ve implemented in prior projects. It has a more sophisticated account creation, sign in, and session-management functionality than I’ve previously worked with, powered by the Python SQLite library. Developing the routine manager tool had the steepest learning curve of this whole project. I taught myself basic Javascript to create the dynamic routine manager, fully organizable by the user, and equipped with product name autofill capabilities. I’m particularly proud of how the routine manager feature turned out.

I also practiced reading over code documentation a LOT while developing this project. I know the Python Plotly library practically inside and out at this point. I nested Plotly’s Dash framework for building standalone data apps within my Flask application, which took a lot of tinkering. I needed to optimize the Dash app to run only when “launched” by visiting the insights page, rather than booting up in parallel (and in the background) with the rest of the app. Then comes the Plotly Cytoscape component which I used for graph visualization. I had some pretty complicated requirements for how I wanted the product insights visualization to look. With few resources outside the documentation (given a library component as niche as Cytoscape), I relied extensively on it for tweaking the appearance, labels, color-scaling, how nodes connect, etc. ChatGPT had no clue how to do anything of this. By pouring into the obscurities of callback function parameters and node networks, I felt like a true engineer.
The end result is something I’m proud of, yet will continue to add features to and refine. I use this project whenever I investigate a new skincare product, highlighting the effectiveness with which it would integrate with the rest of my pre-existing routine. Throughout this process, I have picked up a lot of very valuable skills for future interactive data visualization projects that I’m incredibly eager to apply further.